My Projects
Real-Time System Health Layer: From Metrics to Operational Signals
A scalable observability layer that turns raw backlog, lag, and throughput numbers into time-based signals—so operators answer “are we keeping up?” without interpreting dashboards.
Overview
Most production systems already emit plenty of metrics: queue depth, queue lag, processing drift, and throughput, among others. The hard part is rarely collection—it is decision latency. A backlog of half a million items might be harmless under high throughput, or the first visible sign of a stall. Raw numbers force every on-call to re-derive context under pressure.
This project is a real-time system health layer that sits beside the workload and continuously answers a single operational question in plain language: are we keeping up, or falling behind? Instead of surfacing more charts, it interprets periodic system state and exposes signals—estimated catch-up time, delay in seconds, and trend-aware recovery hints—so meaning is encoded in the system, not reinvented per incident.
The framing is deliberate: metrics describe state; signals support action.
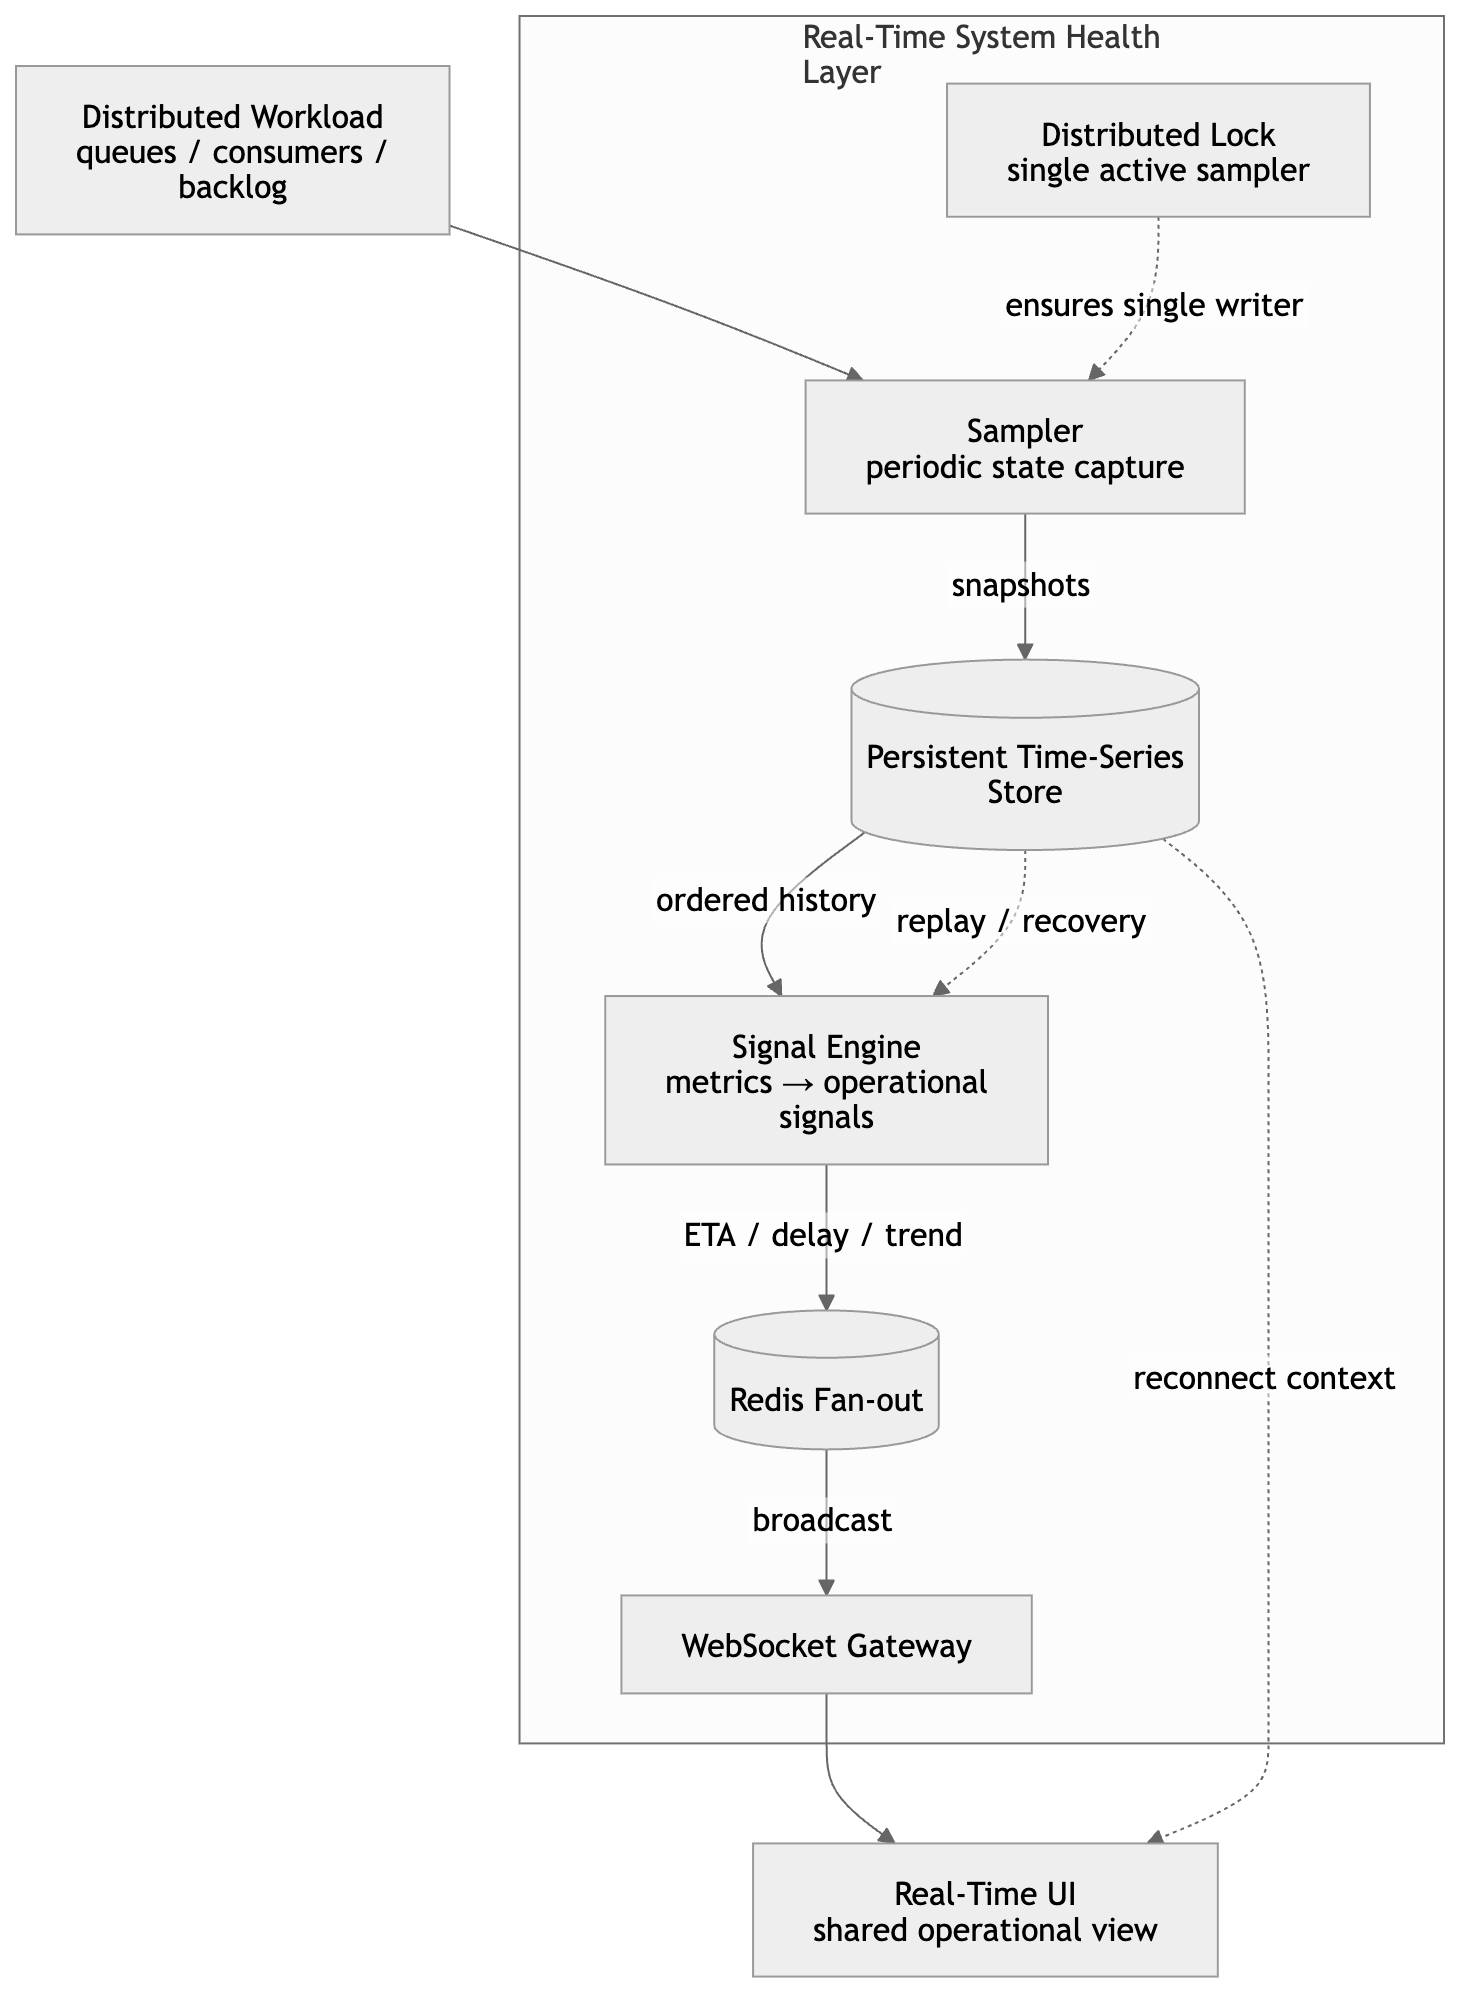
End-to-end architecture
At a high level, the pipeline is intentionally linear and easy to reason about:
Distributed system → Sampler → Persistent time-series store → Signal engine → Real-time UI
- Sampler pulls lightweight snapshots of authoritative operational state (for example backlog, queue lag, and processing counters) on a fixed cadence.
- Store retains ordered snapshots for history, replay, and accurate derivative calculations (throughput, acceleration of lag).
- Signal engine derives human-scale outputs: delay, catch-up ETA, and simple trend classification from the time series—not from a single point in time.
- UI subscribes to precomputed signals so viewers see the same story; there is no per-tab recomputation of heavy logic.
This separation keeps correctness in the storage and computation path, and keeps the presentation path thin and fast.
The diagram below matches that story end to end: a single-writer sampler behind a distributed lock, durable snapshots feeding the signal engine, Redis fan-out for broadcast efficiency, and a WebSocket gateway so the UI stays a thin subscriber with a shared operational view (including reconnect path from history).
Sampling in a horizontally scaled environment
Concurrent sampling from multiple instances would duplicate snapshots, split timelines, and produce contradictory signals. The design therefore enforces exactly one active sampler at a time using a distributed lock (same family of techniques discussed elsewhere in this site’s writing on coordination in distributed systems).
That choice trades a small amount of orchestration complexity for three properties that matter at scale: a single authoritative snapshot stream, deterministic signal computation, and safe horizontal scaling of the surrounding services without scaling the observation fan-out into the data plane.
Persistence, delivery, and fan-out
The layer treats durability and delivery as separate concerns.
Snapshots are persisted as a time series so signals can be validated, backtested after incidents, and reconstructed when the UI reconnects. In parallel, the latest signals are pushed to clients in real time.
To support many concurrent viewers without N× recomputation, a lightweight pub/sub fan-out layer broadcasts updates: the signal engine computes once per material change; subscribers receive the same payload. That pattern keeps CPU bounded as audience size grows and preserves a consistent operational narrative across the room during an incident.
Snapshots instead of full stream consumption
A tempting alternative is to tail the full production stream for “perfect” granularity. That path couples monitoring to the hottest path in the system and can turn observability into competing load.
This design intentionally uses periodic snapshots: slightly coarser granularity in exchange for a stable, non-intrusive observer. Over time, evenly spaced samples still support reliable throughput estimates, ETA-style projections, and delay trends—the quantities operators actually reason about.
The guiding constraint is simple: monitoring should observe the system, not stress it.
Time as the universal interface
Once the goal is operational clarity, the output vocabulary collapses to time:
- backlog and rates become seconds behind;
- lag and throughput deltas become estimated time to catch up;
- noisy counters become trend-aware recovery windows.
That shift removes an entire class of cognitive work during incidents. “We are about two minutes behind” and “recovery in roughly thirty seconds” are directly actionable in a way that isolated gauge values are not.
Outcome
Before this layer, workflows looked like: read metrics → mentally integrate rates and backlogs → argue about whether the situation was “fine.” Afterward, the system owns the interpretation: signals are computed centrally, broadcast consistently, and aligned with how teams actually make go/no-go decisions under time pressure.
The project started as a monitoring improvement; it landed as an abstraction problem—not collecting more data, but reducing uncertainty in what the data already implied.
Closing note
The best observability surfaces are not the ones that show the most series. They are the ones that eliminate ambiguity about whether the platform is winning or losing against its own SLOs in real time. This health layer is my answer to that problem for throughput-bound, queue-heavy systems: one pipeline, one writer, durable history, a fan-out layer for live subscribers, and a UI that speaks in time—not in raw counters.